Here's Golden Phight's Charts:
GOLD 1970's
ECU Daily Chart
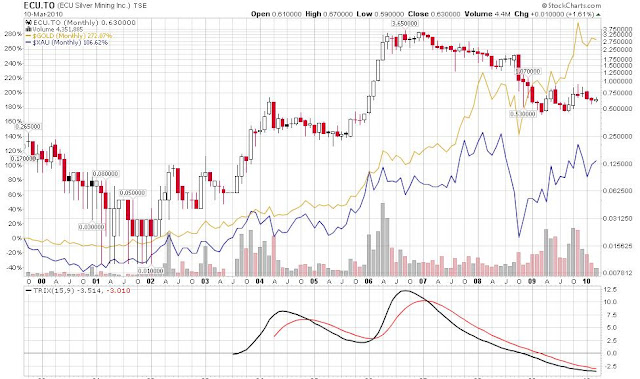
Now let's step back and take a look at a monthly ECU chart:
- The ECU daily chart pattern from 09/2009-present and the ECU monthly chart pattern from 2002-present resembles GOLD's chart pattern 1973- early 1976
- One interpretation of the patten is implying another leg down for ECU before a major upside move?
- Another interpretation is that ECU is currently matching late 1976, and ECU is about to blast off?
- ECU diverged from GOLD and XAU in 2006
- The TRIX momentum indicator is flattening and starting to turn up on the big picture ...
We'll find out soon what happens to this one.


No comments:
Post a Comment