Showing posts with label GLD:UDN. Show all posts

Monday, March 29, 2010

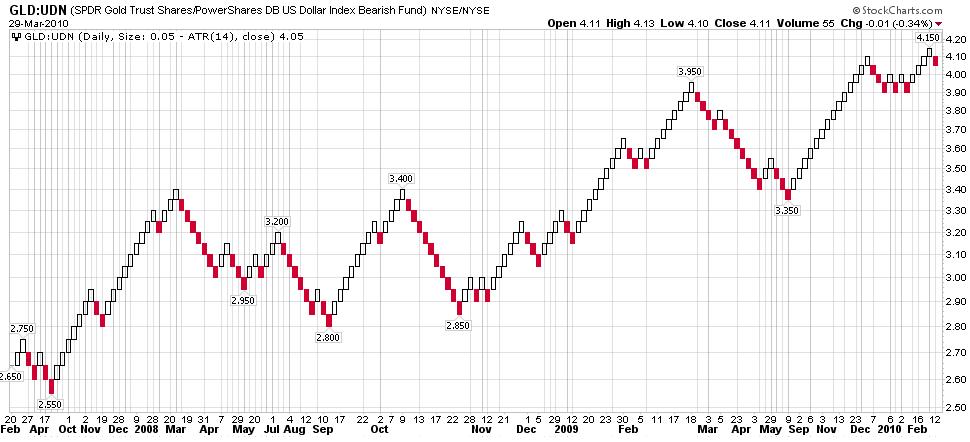
Bullish GLD:UDN Renko Charts


  • Long term weekly Renko chart still in uptrend
  • Short term daily Renko chart made a new high and is currently back testing the breakout
  • Intraday Renko chart is looking bullish

Saturday, March 27, 2010

Kitco Gold Index ~= GLD:UDN

I need to give credit where credit is due. The Kitco Gold Index is where I got the idea of factoring out the effect of USD currency fluctuations from the real supply-demand curve. This can easily be done by plotting a ratio of the equity to UDN. In my previous post I showed you the true picture for GLD and GDX. To show you that this methodology is valid, let's compare a chart of the Kitco Gold Index to my chart:


For a more direct comparison, I'll first show a daily line chart:


However, I prefer to use plot 3 EMA's to smooth out the "noise":


It's not an exact match to the Kitco Gold Index because I am using slightly different data. I am using data that is available to the "common" man - simple ETF's which won't mirror the underlying instrument exactly. However, as you can see, the GLD:UDN chart is pretty close to the Kitco Gold Index.

Wednesday, March 10, 2010

How to factor out the USD from the "true" picture

How much does the $USD influence stock and commodity prices? Are prices going up because the USD is going down or vice versa? We want to factor out the effect of the USD on the supply - demand curve. An easy way to do that is to plot a ratio of the equity against UDN (PowerShares DB US Dollar Bearish Fund).

Here's an example using GLD:


Now we factor out the USD:

Factoring out the $USD, you get a much clearer and more accurate picture of supply-demand.

Followers