Showing posts with label Renko. Show all posts

Saturday, April 3, 2010

Monday, March 29, 2010

Bullish GDX:UDN Renko Charts


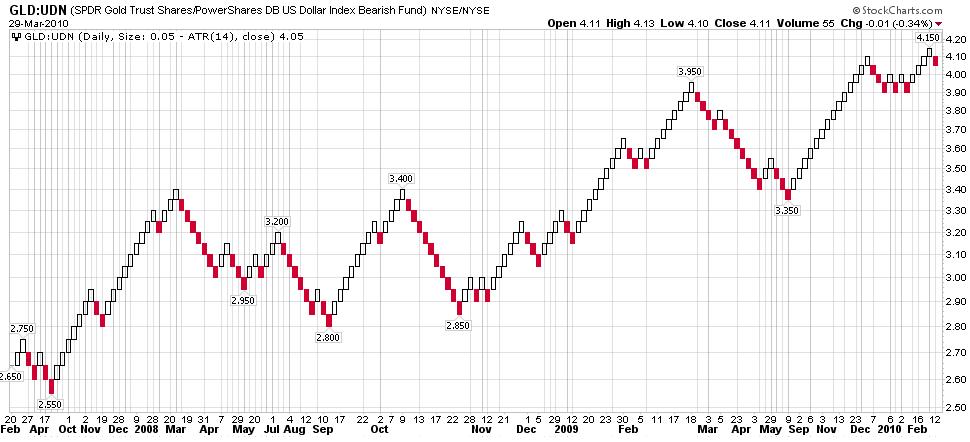
Bullish GLD:UDN Renko Charts


  • Long term weekly Renko chart still in uptrend
  • Short term daily Renko chart made a new high and is currently back testing the breakout
  • Intraday Renko chart is looking bullish

Friday, March 26, 2010

So Far So Good For Gold

Below is today's update of the 60 minute GLD chart:


GLD filled the gap with a strong move today, and $GOLD finished above $1100 which is very promising. The continuation reverse head and shoulders pattern is looking textbook:


GLD held at support on Wednesday. On Thursday, GLD stabilized with an indecision candle, but was followed up with a long white candlestick. Of course, GLD needs to follow through on this and break through the 110.5. Basically, in order to break out of this pattern and resume the uptrend, GLD needs to break through the neckline. The gold miners are saying they will:


I am using the 3 day EMA to reduce the "noise" and draw a more accurate trend line. This chart is saying that the Gold miners broke through the down trend in early March, and a higher low develops, then this is pointing to more higher highs ...


The Renko chart is also confirming the breakout - the current short term trend is still up. In my next post, we'll take a look at how GLD and GDX are performing relative to $USD.

Sunday, March 21, 2010

How to use Renko Charts

You always want to trade with the major trend - the trend is your friend. Renko charts differ from traditional price charts because they ignore the passage of time and focus on price action and trend. Other types of charts with a similar perspective are Point and Figure, Three Line Break, and Kagi charts.If you want to learn more about these, I recommend the following book: Technical Analysis from A to Z, 2nd Edition


Let's take a look at some $GOLD Renko charts:


Use the weekly chart to filter trades using the daily chart to ensure you are trading with (not against) the longer term trend.

Let's take a look at $XAU and $HUI:


Daily Renke Charts


Now, let's step way back and see the big picture for GOLD using a monthly Renko chart:


The long term trend is still  secure. Use the weekly charts to identify the dips and daily charts to time the trade execution.

Followers