Sunday, August 1, 2010

Exxon Mobil - Bullish Divergence


  • Bullish divergences in MACD Histogram and RSI on the monthly chart
  • Bullish divergences on the weekly charts


  • Bullish divergences on the daily charts as well
  • Recommendation: Wait for XOM to reach oversold levels for a better entry point

Sunday, July 25, 2010

Barrick Gold - Question of "When?"

Barrick Gold is the world's top gold producer. They are simply the best:

  • #1 gold reserves
  • #1 gold producer - and finally unhedged
  • tremendous project pipeline
  • provides global diversification in geopolitically stable regions
  • strong balance sheet
  • strong management
  • etc, etc, etc
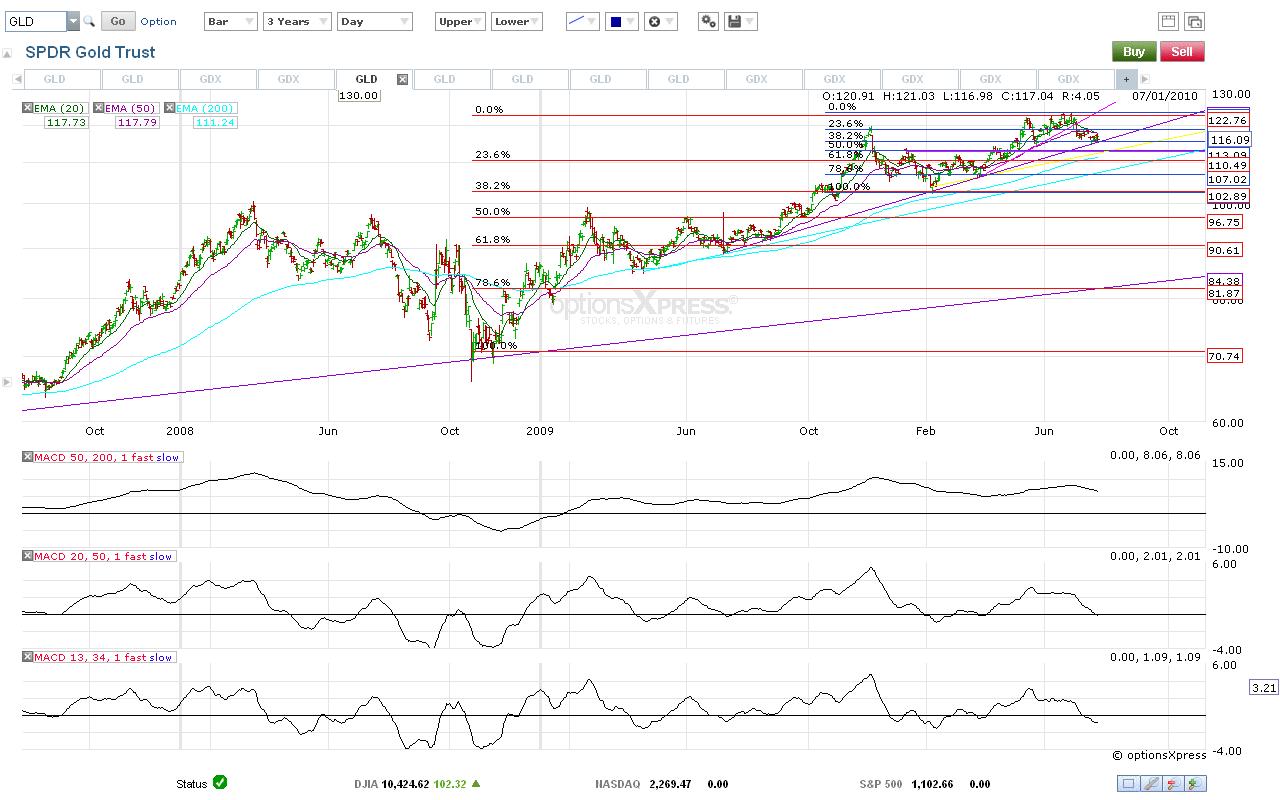
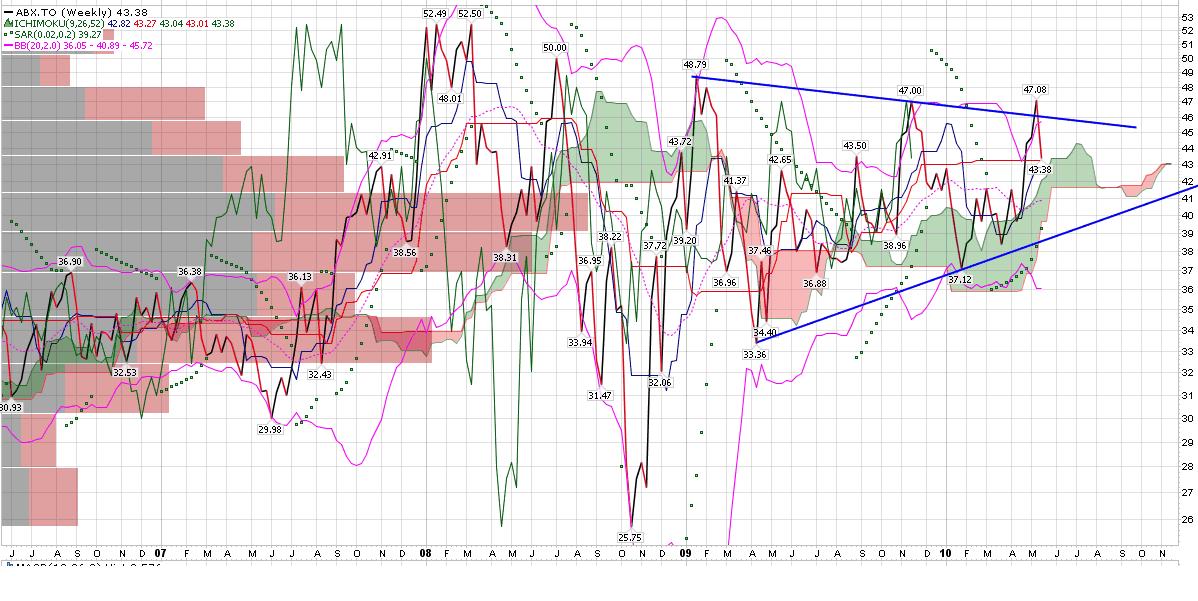
Gold is currently in a correction, and this presents an opportunity to "invest" in Barrick Gold. "Invest" is intentionally quoted, because don't consider this a trade. This is both a value and growth investment opportunity. The charts are indicating the downtrend to continue, but what's interesting is that the Gold miners earnings are coming out this week. Barrick reports on Thursday. Early in the week may be a buy opportunity.


Gold Correction - Chart Updates


  • The trend is still down and is confirmed by the weekly MACD-Histogram and RSI indicators


On the daily charts, the down trend appears to be easing, but the trend is still down. Look for a bullish divergence in the weekly charts for a buy opportunity

Sunday, July 18, 2010

Gold Bearish Divergence Point to Correction

Weekly Chart


  • Class A bearish divergence in weekly MACD and RSI

Daily Charts
  • Indicators on daily charts confirm internal weakness and downward price trend

  • MACD(50,200,1) slope is negative
    • Note the bearish divergence

  • momentum indicators are confirming downtrend

  • volume indicators are also bearish

  • NOTE: The ADX line is moving up and has crossed over the lower line
    • this usually indicates a strong trend move is about to start
Summary
It appears that the long awaited Gold correction has begun which coincides with a wave 5 completion. The retracement target is into the wave 4 formation, which aligns quite nicely with the Fibonacci retracement levels - see the weekly chart above. 

Recommended Strategy: wait for a bullish divergence on the weekly chart before going long.

Sunday, June 6, 2010

Global Markets Crash - Is Gold Next?


The long term secular bull market is still intact. However, Gold may be headed for at least the mid-channel and possibly the bottom of the channel ...In other words, Gold may be entering a corrective phase soon.

Monday, May 24, 2010

ABX - Tale of Two Currencies


  • The $USD has surged on safe haven buying, but it did take a breather lasty week
  • The more "risky" $CDW has been crushed in the last several weeks.
  • Because of high currency volatility, companies dually listed on US and CAD exchanges tell a different story when charted, which makes technical analysis more difficult. 
  • One thing to note is that overall the Gold miners did suffer severe technical damage last week. The $XAU and $HUI have reversed and both are oversold. ABX has not reversed it's trend yet, but it is on the edge - the same goes for Gold.
  • Expect an oversold bounce this week, and be on alert.

Sunday, May 16, 2010

ABX Breakout on Weekly Charts is Confirmed


  • next stop is the 2008 highs ... after it breaks through the 2008 highs, the sky is the limit

Followers