Friday, April 30, 2010

Gold Miners Started Strong - Finished Weak

Gold had a pretty good day. The Gold miners started strong, but faded at the end of the day. While GLD closed +0.95%, the $HUI closed +0.67%.


  • ABX did break out, but I am expecting a retest of the breakout and possibly a retest of the gap in the 41 region
  • A good entry position will be when the MACD reaches oversold conditions on the 60 min chart, which should coincide with a retest of the breakout


ABX is Knocking on the Door


  • Barrick had great earnings and is finally unleashing its full potential with full exposure to unhedged Gold prices.
  • Barrick is surging and volume is confirming
  • When ABX breaks through this 2+ year downtrend line - ABX should explode

Thursday, April 29, 2010

Gold Reserve Analysis

http://www.istockanalyst.com/article/viewarticle/articleid/4024207

Summary:

  • ABX has most GEO
  • HMY is valued low because of high production costs
  • AUY - "over 30% of the firm's gold reserves, as well as the bulk of its copper and molybdenum reserves, are locked up in Agua Rica, a massive undeveloped metal deposit where mine construction will not start until 2012 at the earliest"
  • GRS is overvalued based on production costs,reserves are declining, small reserves
  • EGO and AEM are low cost producers
    • "Agnico-Eagle similarly boasts relatively low production costs, and furthermore owns a slew of attractive development projects throughout North America."
  • Other factors to consider when determining the company's overall value
    • production costs
    • geopolitical risk
    • project pipeline

Wednesday, April 28, 2010

Barrick Trading Plan


  1. Sell if rejected at top of rising channel
  2. Sell if rejected at the gap
  3. Sell if rejected from underside of broken rising trendline

Barrick Gold Breaks Out


  • Gold and miners are breaking out on higher volume
  • Gold miners are reporting impressive earnings - NEM and ABX had very strong earnings

Monday, April 26, 2010

GLD, GDX 60 min charts - 2010-04-26


  • both are in the 61.8% FIB retracement region
  • both are in rising channel
  • both are are hitting medium term falling resistance line
Trading Plan Entry Points:
  1. Breakout above medium term falling resistance line - look for confirmation of inverse HSH neckline breakout
  2. At the bottom of the rising channel line with a tight stop right below the bottom channel line

Sunday, April 25, 2010

Gold Miners Leading Gold on Renko Charts

  • The miners have reversed on the weekly Renko charts before Gold.

Thursday, April 22, 2010

Gold Miners Leading Gold - Pointing to Higher Prices

On the open GLD and GDX gapped down. GLD did recover some but still closed down, while GDX reversed and closed higher.


Be on alert ... tomorrow will be a key day

Tuesday, April 20, 2010

EGO - Short Term Still Bearish


  • gap on the open had no follow through
  • lower high formed -> pointing to lower low
  • TRIX is formed a slight bullish divergence
  • The 61.8% retracement looks like a good price target to re-enter
  • looks like GDX wants to test the GAP once more

$XAU:$GOLD -> Miners are Historically Undervalued

Monday, April 19, 2010

EGO - Long Entry Position Charts


This is a Gold miner leader

Bullish on Gold


  • GLD is still clearly in an uptrend.
  • MACD histogram slope is still positive
  • Force index 13 EMA is positive and at support
  • ADX is still indicating that the uptrend is still intact

  • GLD will run into GAP and overhead cloud resistance. The GAP will be key here.
  • The short term outlook is negative because Gold needs to shake off the smackdown and fight back here through GAP. 

  • The GDX:GLD ratio slope is rising - which is bullish for Gold

Wednesday, April 14, 2010

Revisiting the SPY Trend

The S&P 500 has been on a tear. How healthy is this trend. Let's first take a look at the long term charts.

  • Spy is approaching the underside of the cloud. In otherwise, it's about to enter a resistance zone. 
  • The uptrend since last March has been almost as vertical on the way up then on the way down.
  • SPY has an opening in the cloud that ICHIMOKU is forecasting towards the end the year. 
  • The trend indicators all look very healthy and are confirming the uptrend

  • Weekly trend is still bullish. It is overbought, but has been for a while.
  • NOTE: the downtrend line Oct 2008 has been broken through with a successful retest
  • Weekly indicators are also confirming the uptrend.
  • Thus, any pull back on the daily chart should represent a "BUY" opportunity
  • SPY is extremely overbought on the daily chart. Some may say this is a sign of "strength", however, I say this is a sign of weakness in the $USD ...


The long term trends in the monthly and weekly charts are running into strong resistance. A closer look at the weekly $USD chart shows that the downtrend is resuming. On the daily chart, the $USD is currently oversold. The cloud should provide some support in the short term. Look for a back test of the broken downtrend for a shorting opportunity.

Friday, April 9, 2010

Bearish Divergences $NYAD and $NYHL -> Bull Trap Set Up


Think of the NYHL as representing military officers and $NYAD as representing the soldiers. The officers usually lead the soldiers. Here we see the officers and soldiers started to retreat in late March. Starting in April, it looks like they are trying to mount a weak rally while still looking like they are planning to retreat. This is looking like a typical wave 5 that is running out of steam. 


Thursday, April 8, 2010

Gold Followed Through With Breakout


  • The continuation reverse H-S-H breakout
  • Broke through longer term down trend line as well
  • Take note of the bullish divergence in the MACD histogram - this is an excellent way to peer at the internal strength (or weakness)
  • The preliminary price target for the H-S-H breakout is around $120 - which  aligns with a retest of the previous high ... 


  • Volume was above average, i.e., above the 5 EMA
  • ADX line is below the +DI and -DI lines and turning up. Keep an eye on ADX slope and when it starts crossing the +DI and -DI lines.

Wednesday, April 7, 2010

Bulls Look Tired - Bearish Divergence for SPY


Be on the look out for a potential head and shoulders top forming.

Monday, April 5, 2010

Gazing Into the Ichimoku Cloud

Reference: Ichimoku Cloud


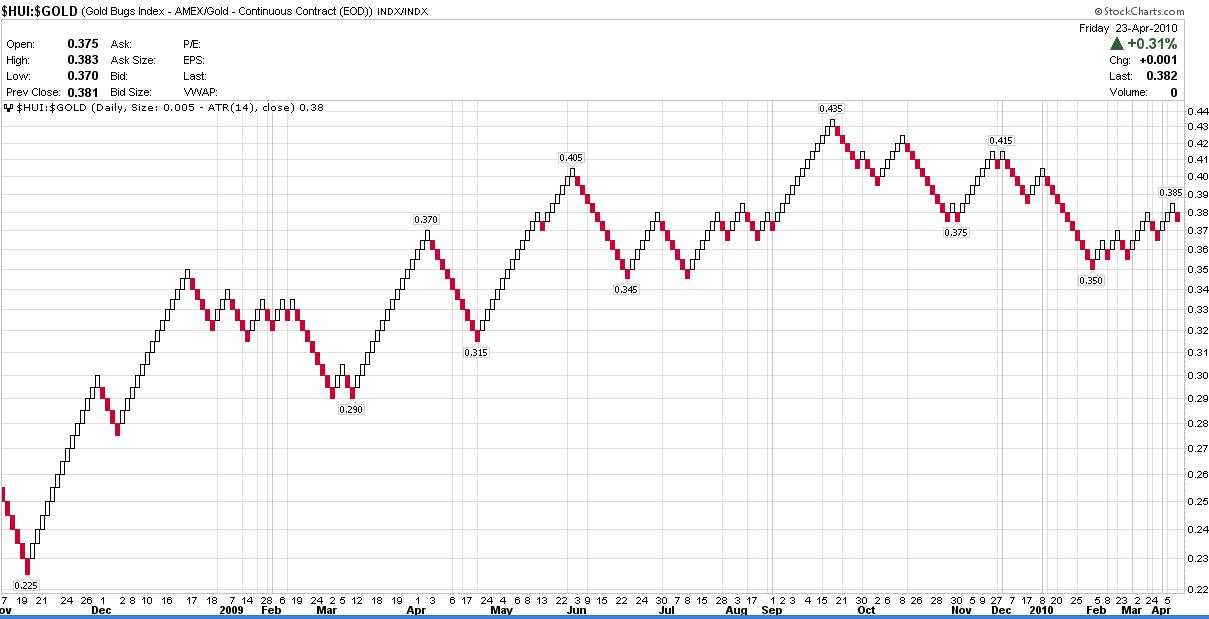
On the daily chart, Gold has cleared the cloud. Wait for Turning (blue) line to cross the Standard (red) line for an entry position.


On the weekly chart, the forecast calls for clear skies ahead.


The same goes for $XAU. Finally, let's take a look at the good old $USD:


On the daily chart, the $USD still looks bullish.


On the longer term weekly chart, the $USD is running into resistance, but is making a valiant effort to break through the cloud. US Treasury Bonds are forecasting that the $USD rally is not done yet.


It'll be interesting because of the inverse relationship between bonds and commodities. If bonds plummet then expect this to fuel another leg in commodities. Conversely, if bond prices go down, then yields go up, which is bullish for the $USD. Historically, bonds lead the overall market by 6 months. If bonds start going down, expect the markets to follow about 6 months later.


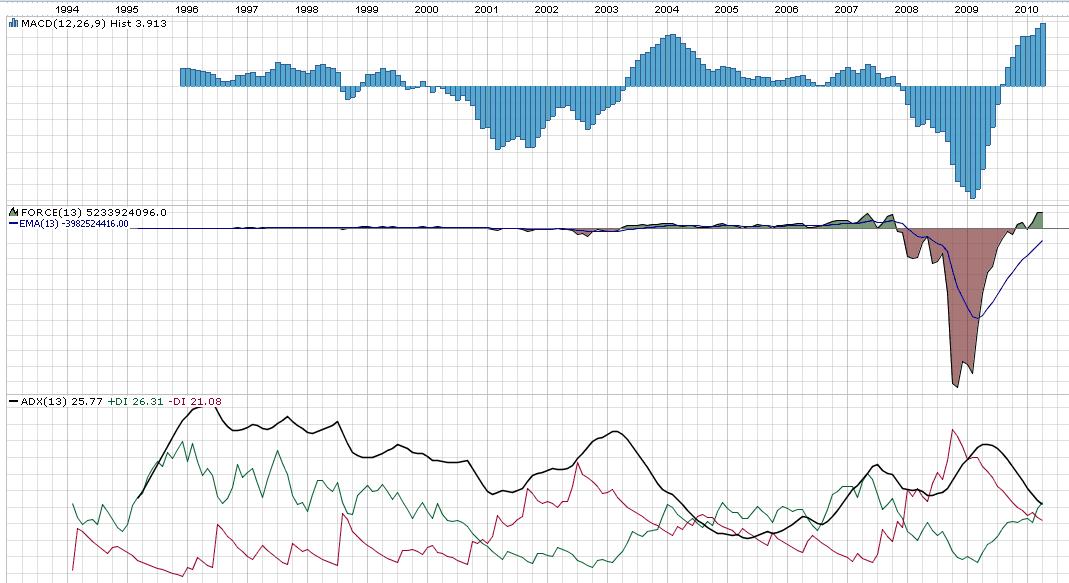
Notice how the commodity index, which is dominated by Oil, has quietly emerged from the cloud.

Followers