
- Spy is approaching the underside of the cloud. In otherwise, it's about to enter a resistance zone.
- The uptrend since last March has been almost as vertical on the way up then on the way down.
- SPY has an opening in the cloud that ICHIMOKU is forecasting towards the end the year.
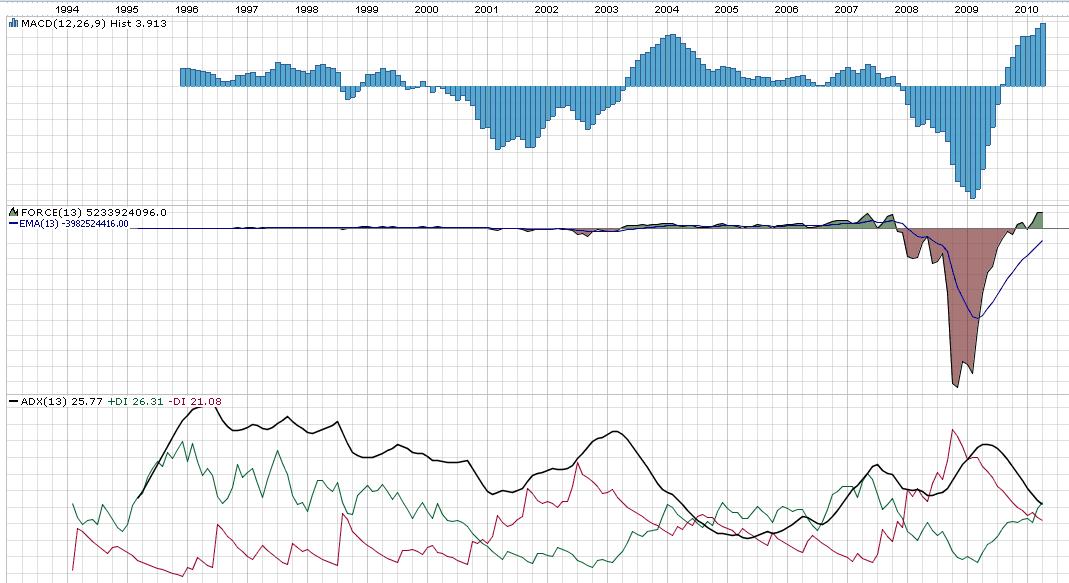
- The trend indicators all look very healthy and are confirming the uptrend

- Weekly trend is still bullish. It is overbought, but has been for a while.
- NOTE: the downtrend line Oct 2008 has been broken through with a successful retest

- Weekly indicators are also confirming the uptrend.
- Thus, any pull back on the daily chart should represent a "BUY" opportunity

- SPY is extremely overbought on the daily chart. Some may say this is a sign of "strength", however, I say this is a sign of weakness in the $USD ...


The long term trends in the monthly and weekly charts are running into strong resistance. A closer look at the weekly $USD chart shows that the downtrend is resuming. On the daily chart, the $USD is currently oversold. The cloud should provide some support in the short term. Look for a back test of the broken downtrend for a shorting opportunity.


No comments:
Post a Comment